Project cell values to mesh-points#
This section demonstrates how to move cell-values, located at the quadrature points
of cells, to mesh-points. The results of topoints(),
extrapolate() and project() are compared for the
Cauchy stresses of a rectangular block under compression.
import felupe as fem

region = fem.RegionQuad(mesh=fem.Rectangle(b=(2, 1), n=(11, 6)))
field = fem.FieldContainer([fem.FieldPlaneStrain(region, dim=2)])

boundaries = fem.dof.uniaxial(
    field, clamped=True, move=-0.3, axis=1, return_loadcase=False
)
solid = fem.SolidBody(umat=fem.NeoHooke(mu=1, bulk=5), field=field)

job = fem.Job(steps=[fem.Step(items=[solid], boundaries=boundaries)]).evaluate()
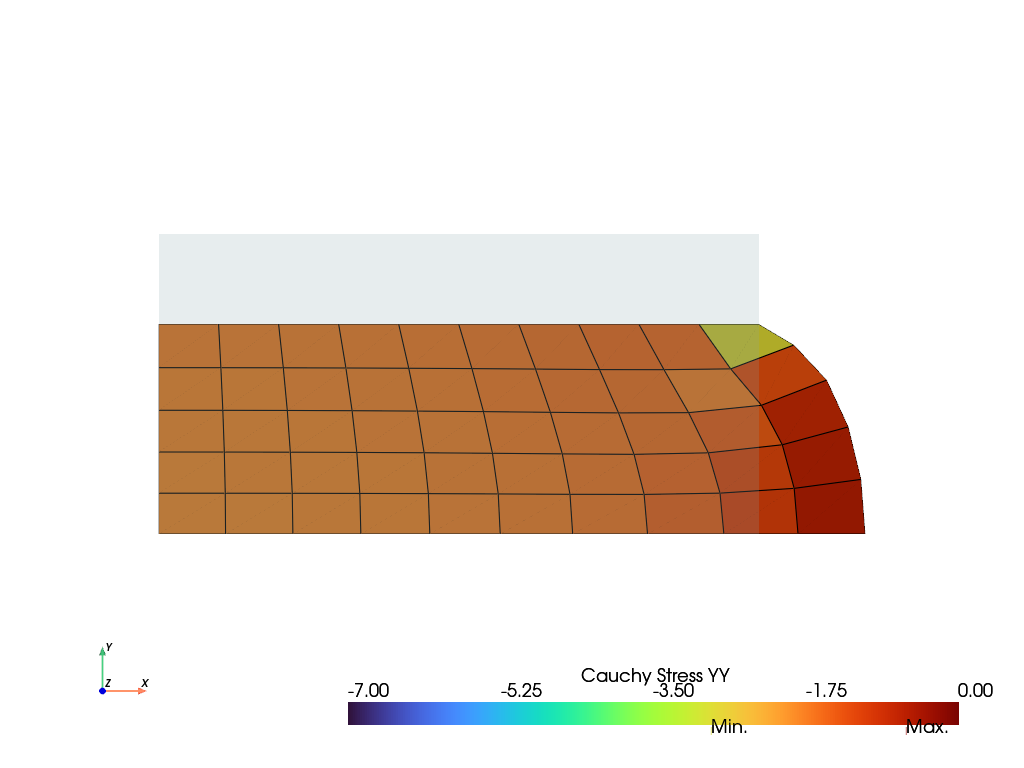
Cell-based results, like Cauchy stresses, are not projected to mesh-points by default. The means of the cell-values are plotted if no projection method is specified. Different methods may be used to move the cell-data to the mesh-points.
With
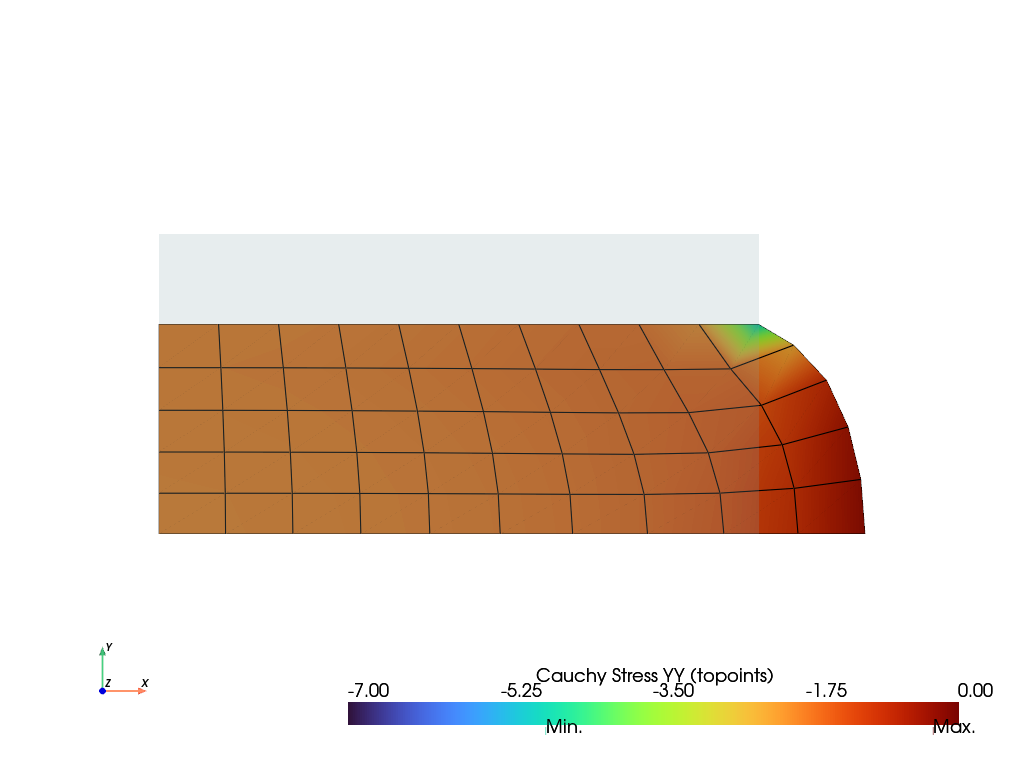
topoints(), the cell-values are translated to and averaged at the mesh-points.With
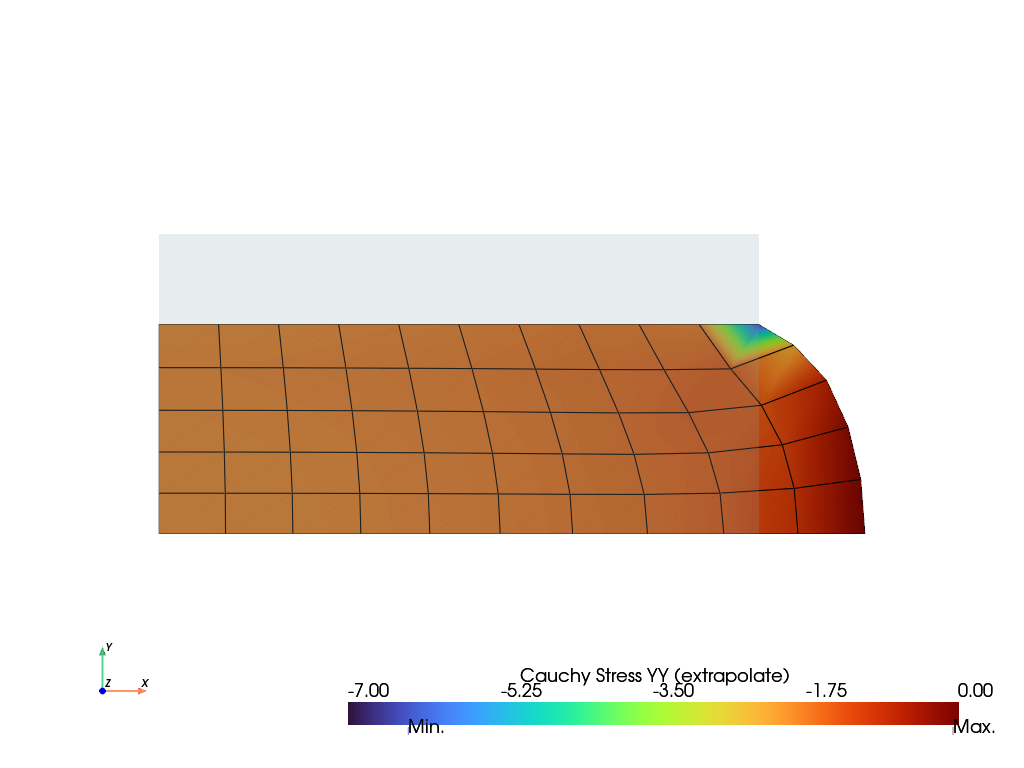
extrapolate(), the cell-values are extrapolated to the mesh- points by evaluating the cell-values at the quadrature points of the cells and extrapolating them to the mesh-points.With
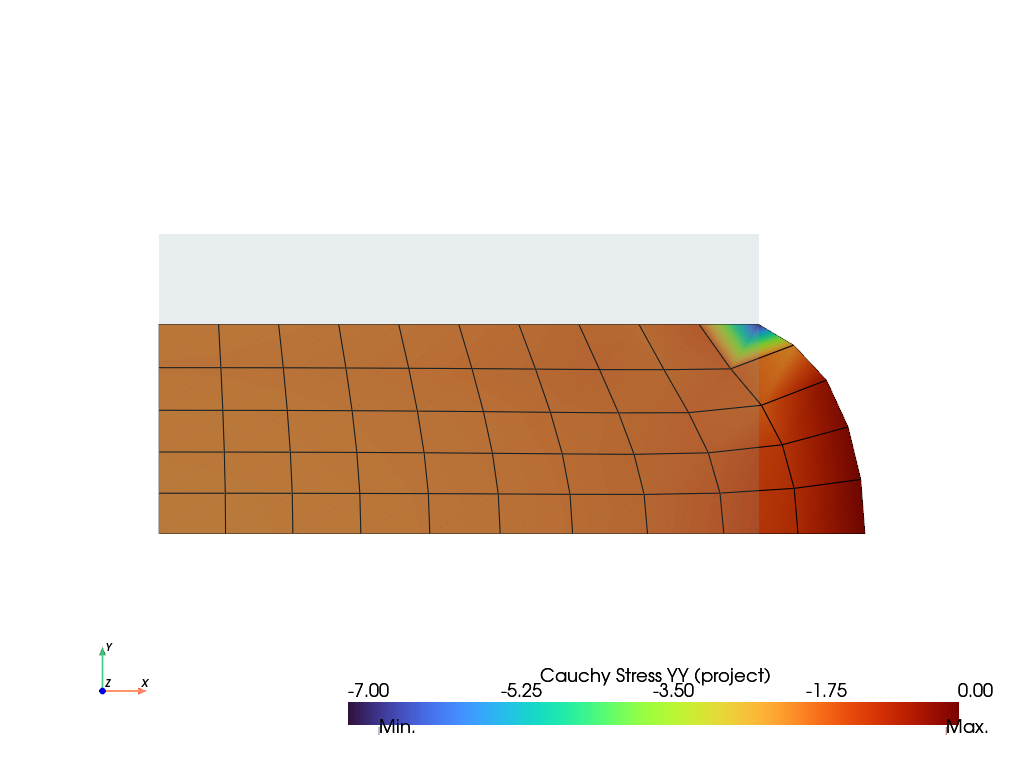
project(), the cell-values are projected to the mesh-points by solving a least-squares problem.
stress = solid.evaluate.cauchy_stress()[1, 1]
data = stress.mean(axis=0)
annotations = {data.min(): "Min.", data.max(): "Max."}

plotter = solid.plot(
    name="Cauchy Stress",
    label="Cauchy Stress YY",
    component=1,
    project=None,
    clim=[-7.0, 0.0],
    annotations=annotations,
).show()
stress = solid.evaluate.cauchy_stress()[1, 1]
data = fem.topoints(stress, region)
annotations = {data.min(): "Min.", data.max(): "Max."}

plotter = solid.plot(
    name="Cauchy Stress",
    label="Cauchy Stress YY (topoints)",
    component=1,
    project=fem.topoints,
    clim=[-7.0, 0.0],
    annotations=annotations,
).show()
stress = solid.evaluate.cauchy_stress()[1, 1]
data = fem.tools.extrapolate(stress, region)
annotations = {data.min(): "Min.", data.max(): "Max."}

plotter = solid.plot(
    name="Cauchy Stress",
    label="Cauchy Stress YY (extrapolate)",
    component=1,
    project=fem.tools.extrapolate,
    clim=[-7.0, 0.0],
    annotations=annotations,
).show()
stress = solid.evaluate.cauchy_stress()[1, 1]
data = fem.project(stress, region)
annotations = {data.min(): "Min.", data.max(): "Max."}

plotter = solid.plot(
    name="Cauchy Stress",
    label="Cauchy Stress YY (project)",
    component=1,
    project=fem.project,
    clim=[-7.0, 0.0],
    annotations=annotations,
).show()